Hypothesis Testing
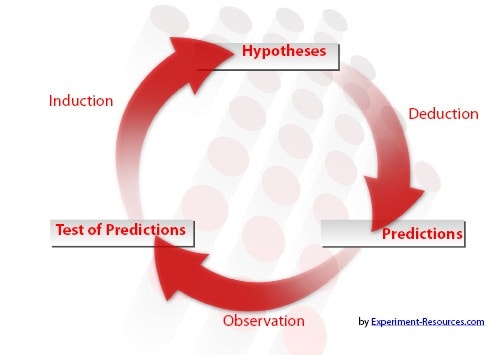
Once you have generated a hypothesis, the process of hypothesis testing becomes important.
This article is a part of the guide:
Browse Full Outline
- 1Scientific Method
- 2Formulate a Question
- 3Collect Data
- 4Test Hypothesis
- 5Conclusion
- 6Overview
Your hypothesis statement took the form of a prediction or speculation. Once the experiment has been carried out, you can now assess whether this prediction was correct or not.
You should therefore have two hypotheses, the alternative and the null.
H1 The alternative hypothesis: This is the research hypothesis. It is the scientist’s speculation/prediction at the heart of the experiment.
H0 The null hypothesis: The is a statement that there is NO significant difference in groups, or more generally, that there is no association between two groups. In other words, it is describing an outcome that is the opposite of the research hypothesis. The original speculation is not supported.
Conventionally, it is good practice to assume that the null hypothesis is correct until proven otherwise.
This means researchers don’t seek out to accept their research hypothesis, but rather to accept or reject the null hypothesis first, which then allows them to accept or reject the alternative hypothesis. Though most research is conducted with an expectation of how the results will turn out, good practice is to make ample room for the possibility that your hypothesis is wrong.
For testing, you will be analyzing and comparing your results against the null hypothesis, so your research must be designed with this in mind. It is vitally important that the research you design produces results that will be analyzable using statistical tests.

Most people are very afraid of statistics, and worry about not understanding the processes or messing up the experiments. There really is no need to fear.
Most scientists understand only the basic principles of statistics, and once you have these, modern computing technology gives a whole battery of software for hypothesis testing.
Designing your research only needs a basic understanding of the best practices for selecting samples, isolating testable variables and randomizing groups.

Hypothesis Testing Example
A common statistical method is to compare the means of various groups.
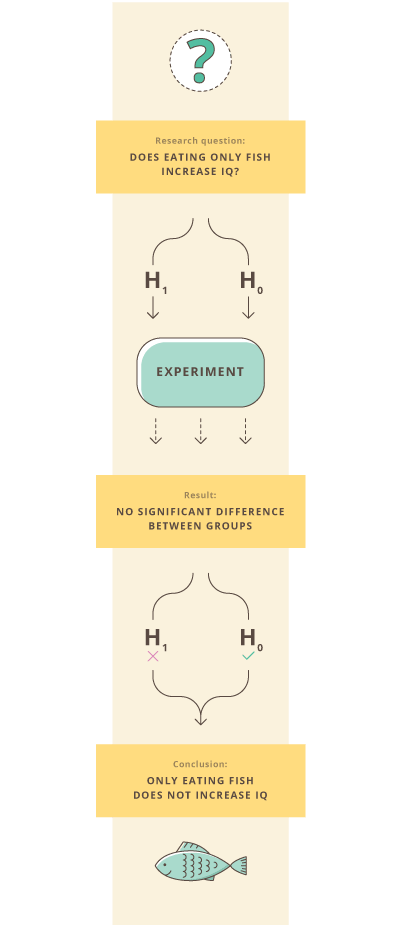
For example, you might have come up with a measurable hypothesis that children will gain a higher IQ if they eat oily fish for a period of time.
Your alternative hypothesis, H1 would be
“Children who eat oily fish for six months show an increase in IQ when compared to children who have not.”
Therefore, your null hypothesis, H0 would be
“Children who eat oily fish for six months do NOT show an increase in IQ when compared to children who have not.”
In other words, with the experiment design, you will be measuring whether the IQ increase of children fed oily fish will deviate from the mean, assumed to be the normal condition.
- H0 = No increase. The children will show no increase in mean intelligence.
- H1 = A significant increase. The children show an increase in mean intelligence.
From IQ testing of the control group, you find that the control group has a mean IQ of 100 before the experiment and 100 afterwards, or no increase. This is the mean against which the sample group will be tested.
The children fed fish show an increase from 100 to 106.
So, does this mean that we can reject the null hypothesis and conclude that our alternative hypothesis was in fact true?
While there does appear to be an increase, but here is where statistics enters the hypothesis testing process. You need to test whether the increase is significant, or if experimental error and standard deviation could account for the difference.
On the surface, a result may appear to human intuition to be meaningful. But statistical testing can show us whether the result we see is statistically meaningful and big enough to draw any conclusions.
Using an appropriate test, the researcher compares the two means, taking into account the increase, the number of data samples and the relative randomization of the groups. The researchers may use a statistical test called a t-test, and compare the p-value they find on a table. This result shows whether the researcher can have confidence in the results.
If the p-value is above a certain value, the researchers can be assured that the difference is not just due to chance or error. This allows for the rejection of the null hypothesis. In our example, the 6-point difference does not in fact prove to be significant.
Thus, many experiments provide results that go against our expectations. While casual observation may show a difference or relationship between two groups, it may not be a statistically significant difference.
A well-worded hypothesis will mean that if we reject H0, we must logically accept H1. In other words, there is either a change or there is no change, there is no other possibility.
Remember, not rejecting the null hypothesis is not the same as accepting it. It is only that this particular experiment showed that oily fish had no affect upon IQ. This principle lies at the very heart of hypothesis testing.

Significance
The exact type of statistical test used depends upon many things, including the field, the type of data and sample size, among other things.
The vast majority of scientific research is ultimately tested by statistical methods, all giving a degree of confidence in the results.
For most disciplines, the researcher looks for a significance level of 0.05, signifying that there is only a 5% probability that the observed results and trends occurred by chance.
For some scientific disciplines, the required level is 0.01, only a 1% probability that the observed patterns occurred due to chance or error. Whatever the level, the significance level determines whether the null or alternative is rejected, a crucial part of hypothesis testing.
Martyn Shuttleworth, Lyndsay T Wilson (Nov 14, 2008). Hypothesis Testing. Retrieved Feb 11, 2026 from Explorable.com: https://explorable.com/hypothesis-testing
You Are Allowed To Copy The Text
The text in this article is licensed under the Creative Commons-License Attribution 4.0 International (CC BY 4.0).
This means you're free to copy, share and adapt any parts (or all) of the text in the article, as long as you give appropriate credit and provide a link/reference to this page.
That is it. You don't need our permission to copy the article; just include a link/reference back to this page. You can use it freely (with some kind of link), and we're also okay with people reprinting in publications like books, blogs, newsletters, course-material, papers, wikipedia and presentations (with clear attribution).
Get all these articles in 1 guide
Want the full version to study at home, take to school or just scribble on?
Whether you are an academic novice, or you simply want to brush up your skills, this book will take your academic writing skills to the next level.
Download electronic versions:
- Epub for mobiles and tablets
- For Kindle here
- PDF version here
This article is a part of the guide:
Browse Full Outline
- 1Scientific Method
- 2Formulate a Question
- 3Collect Data
- 4Test Hypothesis
- 5Conclusion
- 6Overview
Footer bottom


